Arizona Energy Pain Index
Last edited
Author
Andrew Blok
Electrification and Solar Writer and Editor

It's not just in your head. Everything is more expensive.
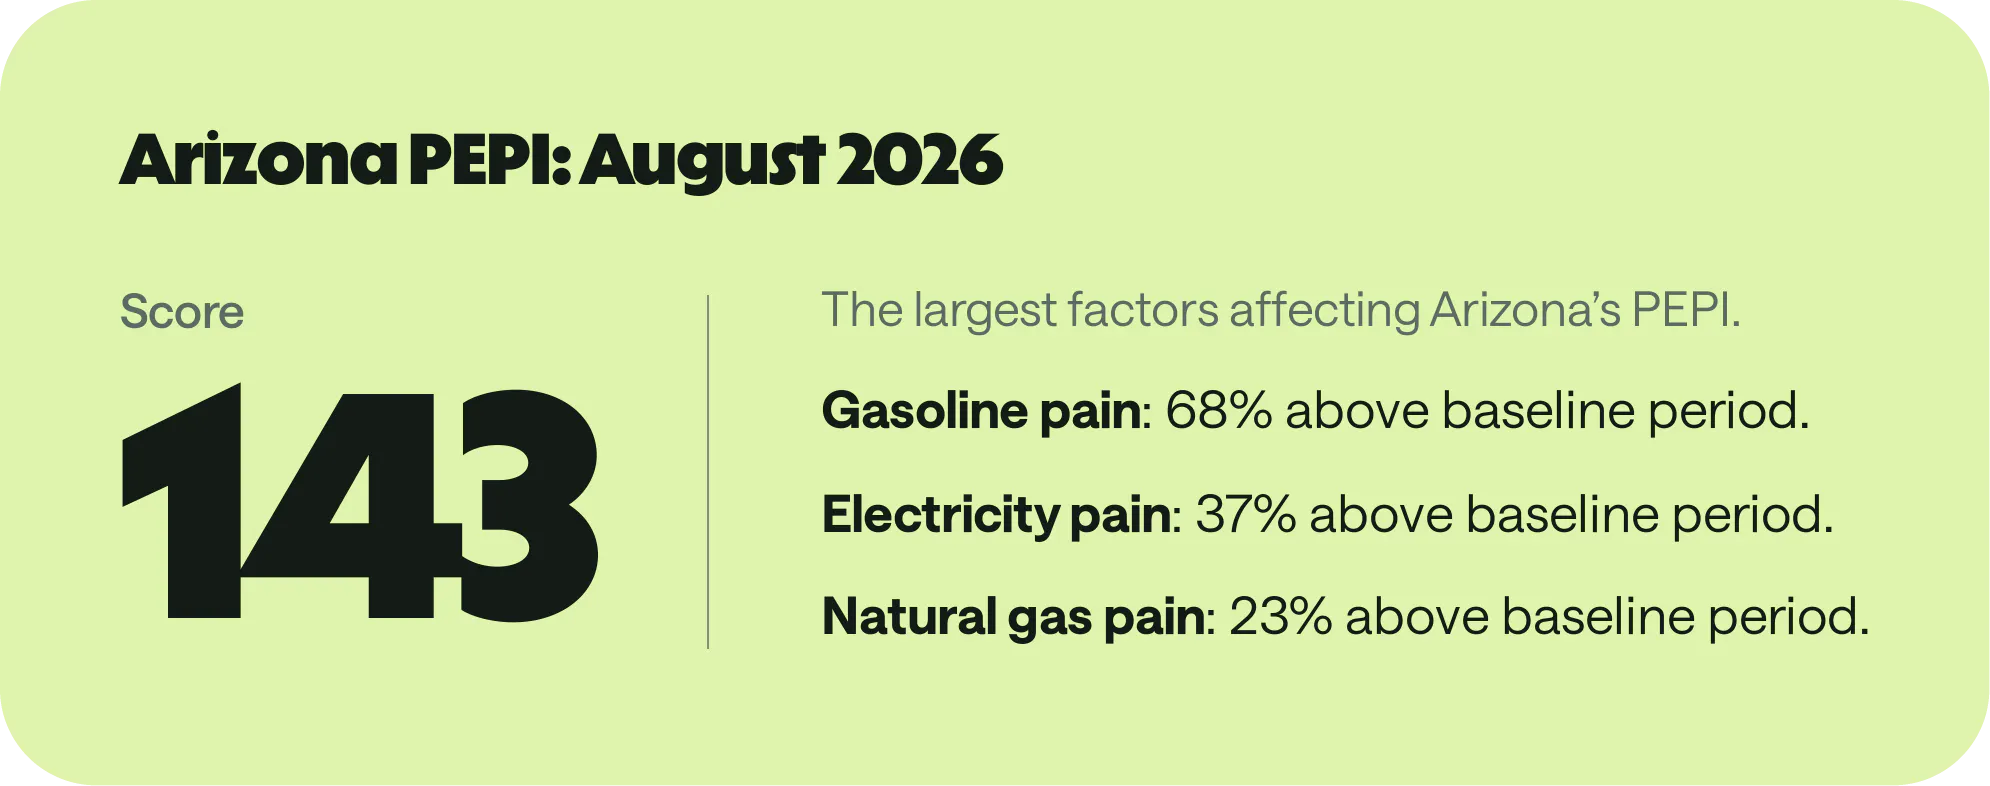
Energy prices are up and unpredictable. That makes energy more painful to afford, a reality reflected in Palmetto’s Energy Pain Index (PEPI) for Arizona.
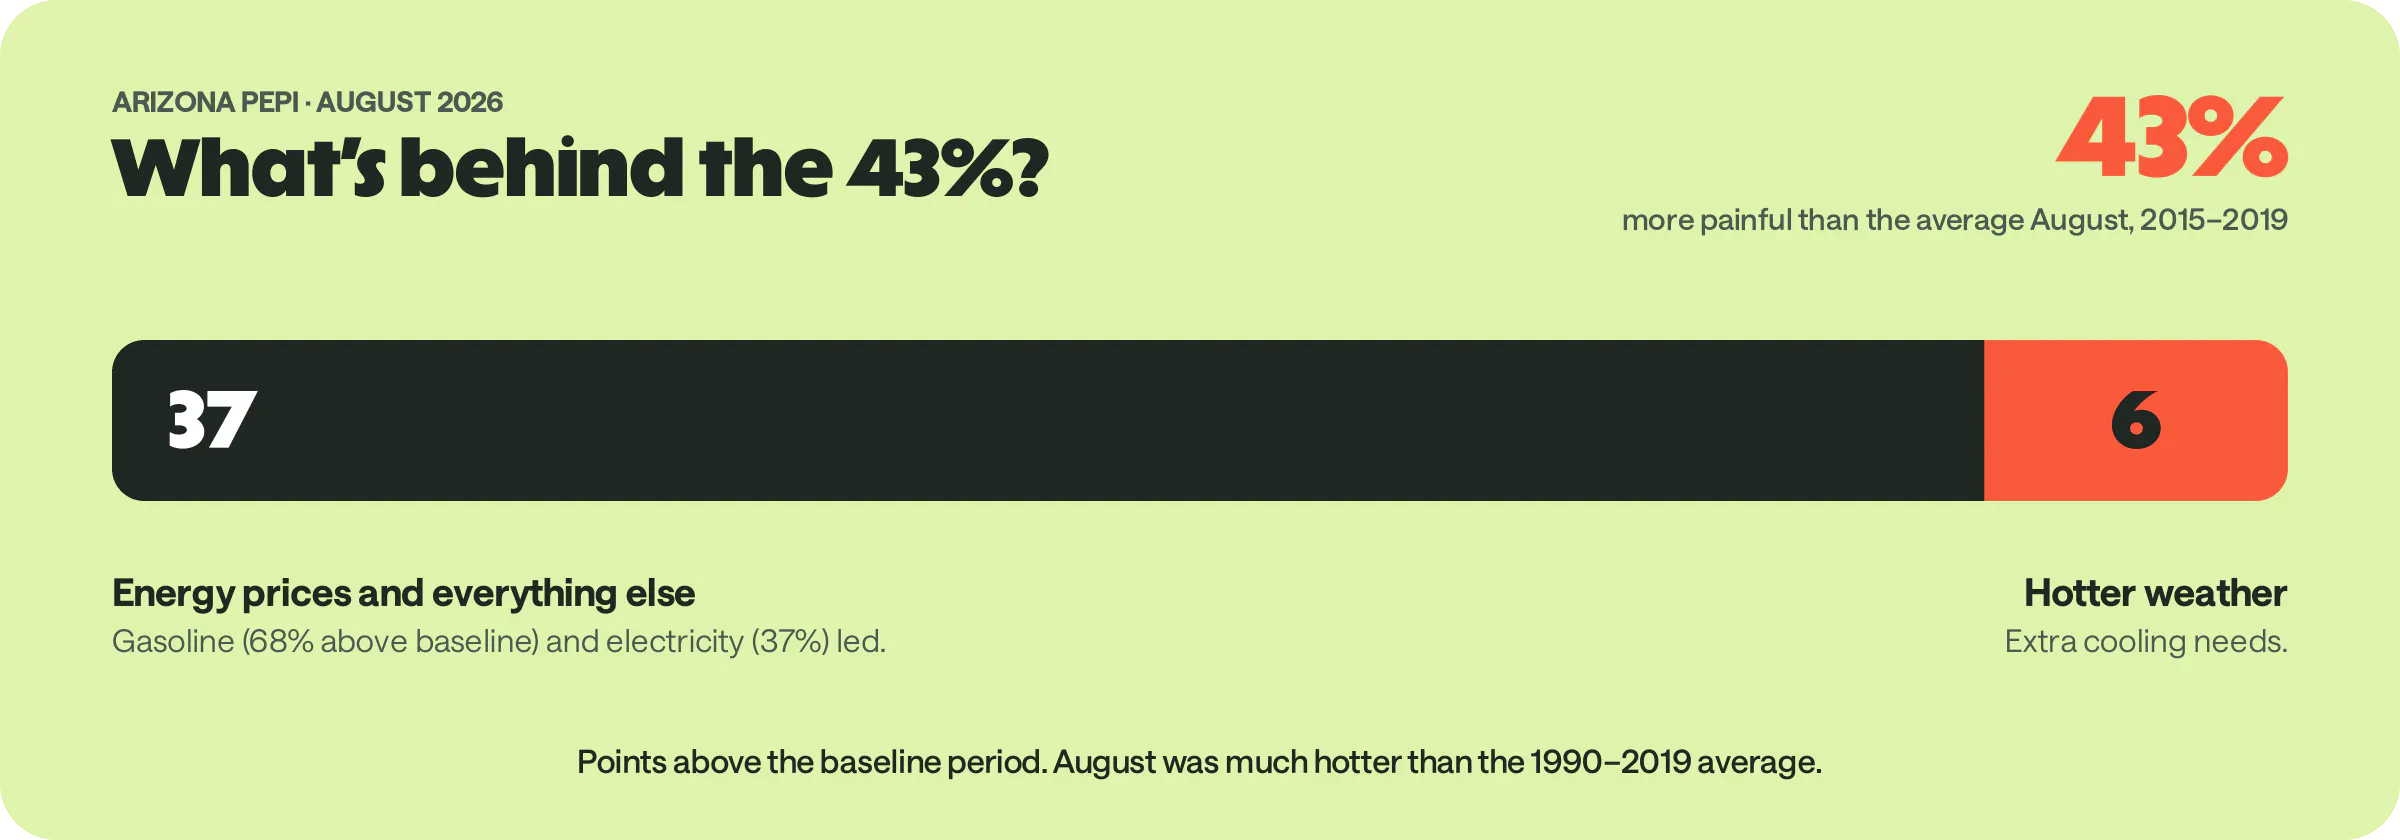
According to PEPI, energy prices and hotter than average weather conspired to make affording energy in August 43% more painful than it was in the average August from 2015-2019. The largest force in PEPI’s high score was gasoline (68% above baseline), while electricity (37%) also pushed PEPI higher. As would be typical in summer, natural gas pain was lower thanks to lower heating needs, but still higher than the baseline.
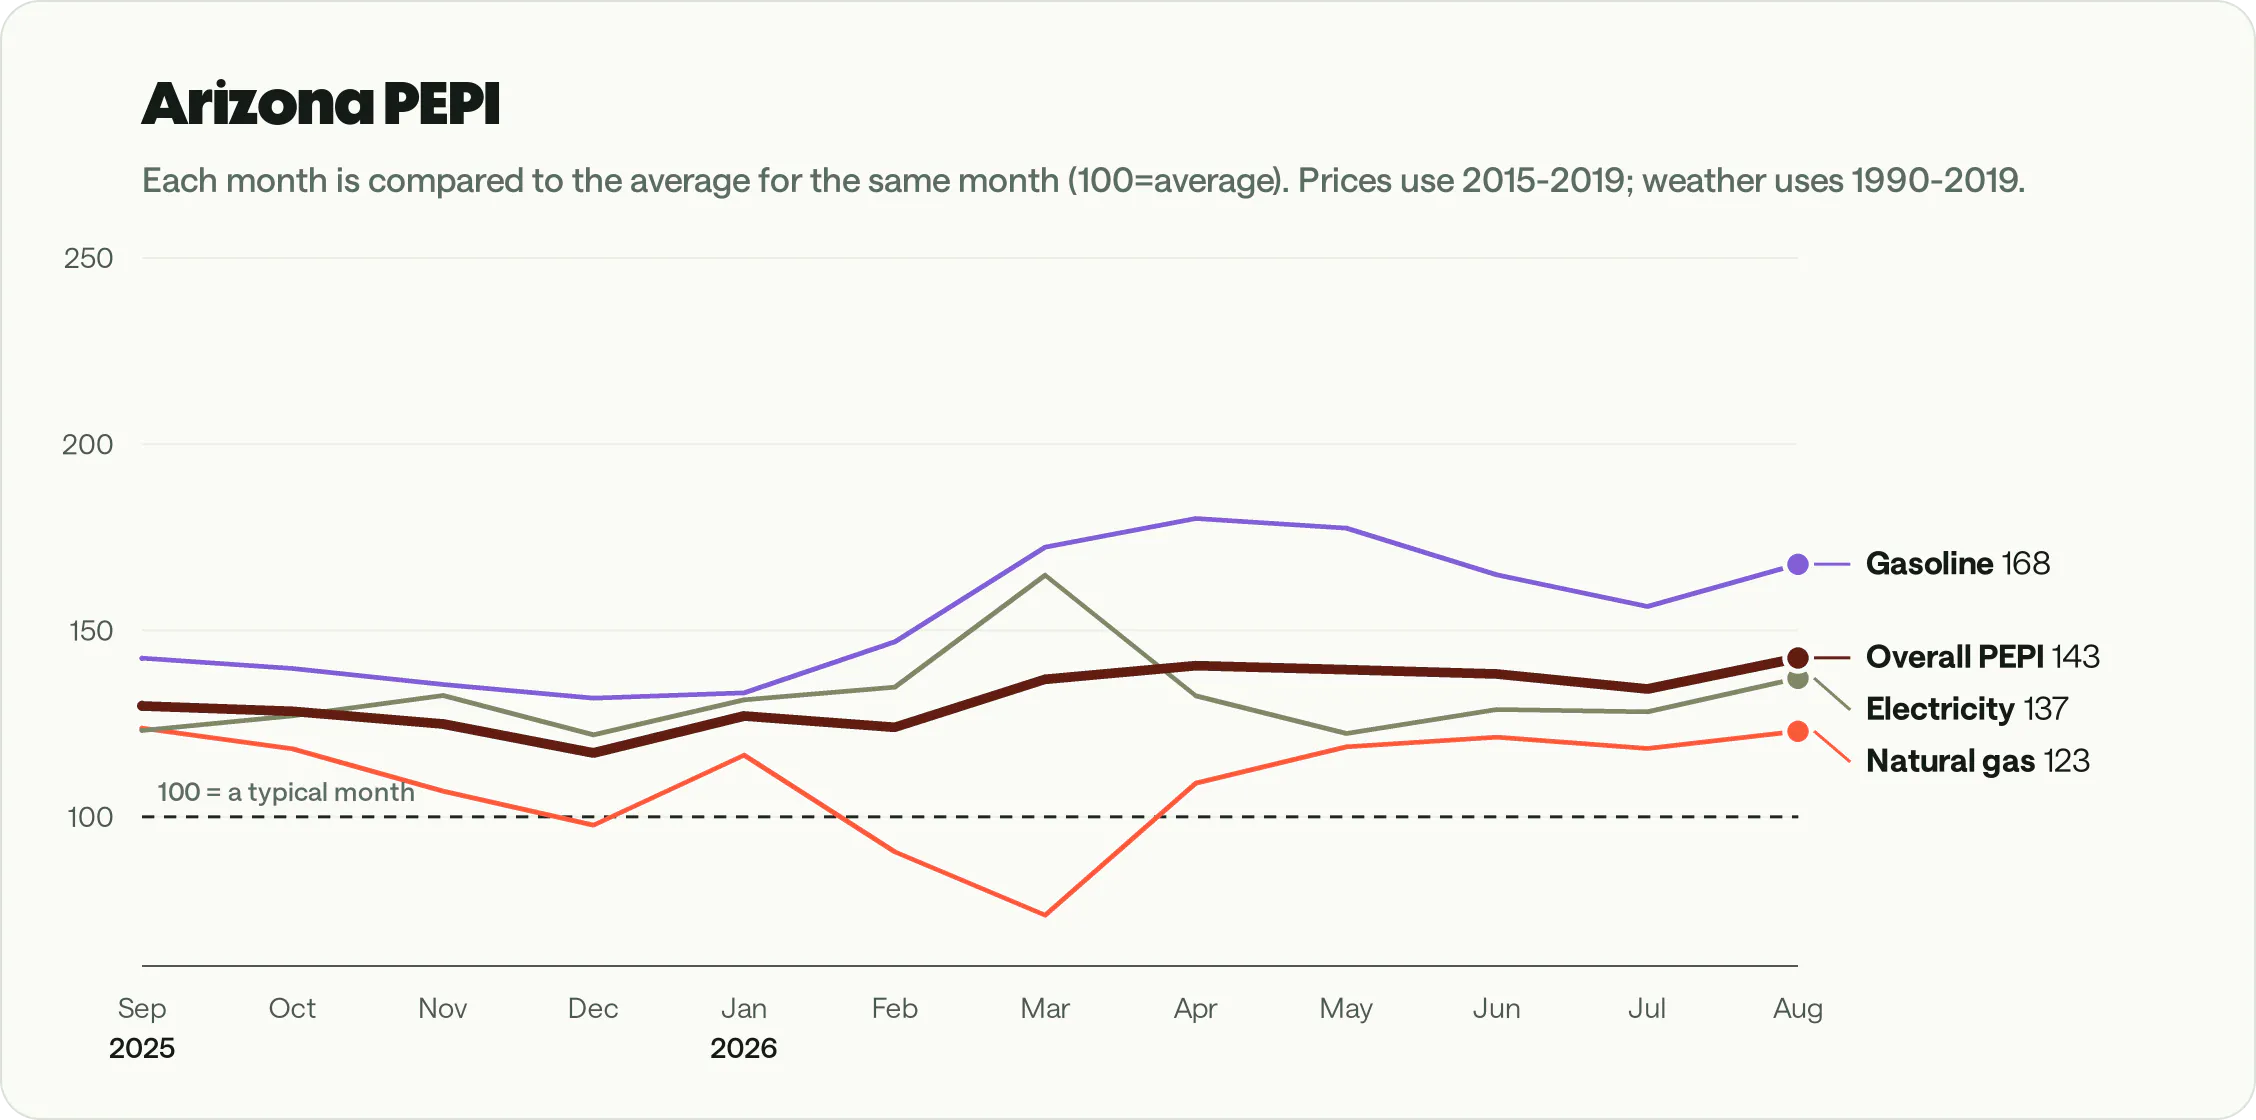
Higher values mean the current month costs more than it typically does at this time of year.
August was much hotter than the 1990-2019 average, spiking cooling needs and pushing PEPI higher. Weather added about 6 points to the score, almost all of it through electricity.
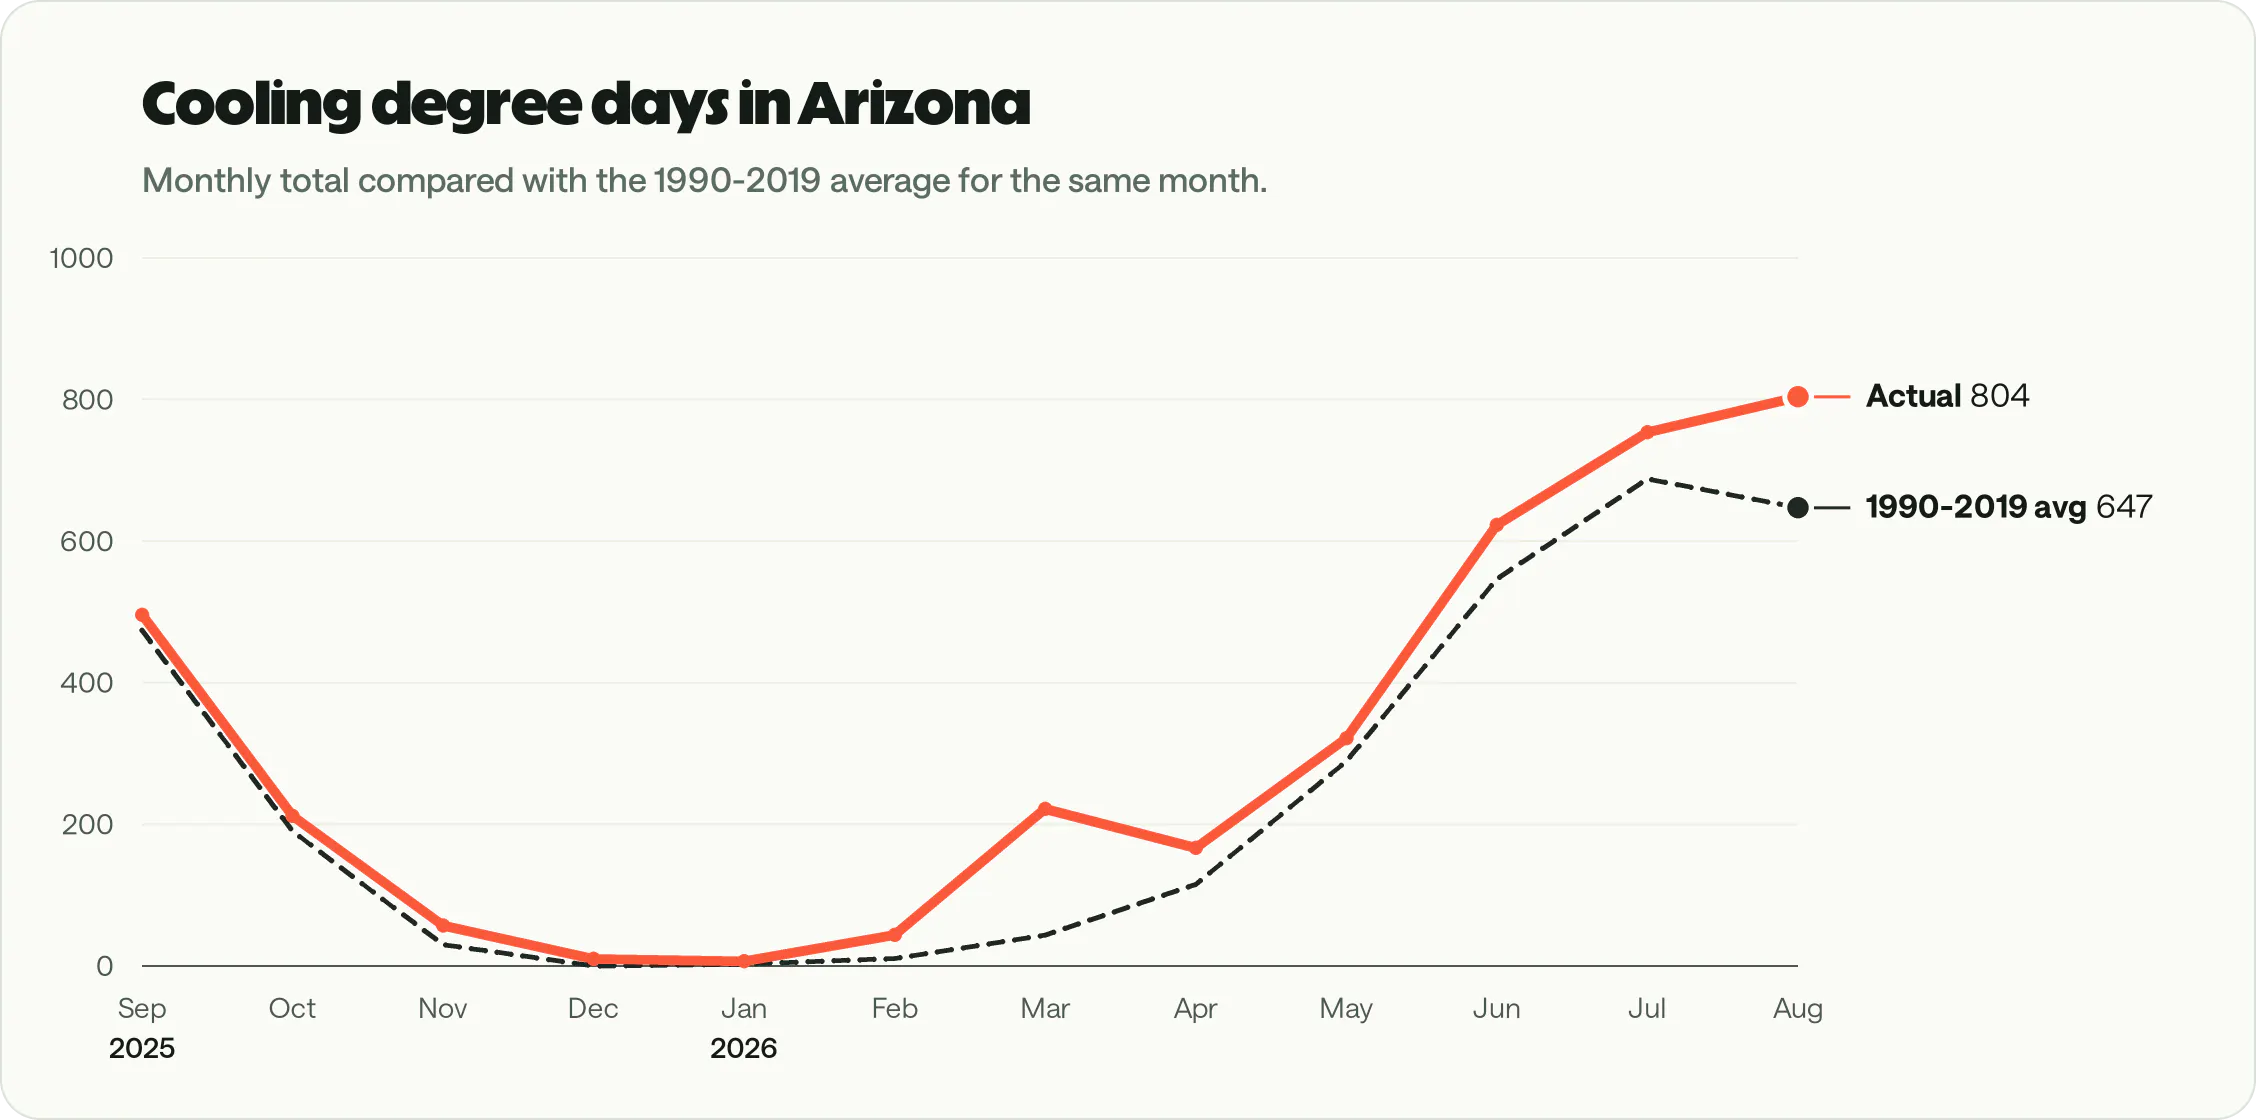
Cooling degree days are the standard measure of how temperature increases the need for air conditioning.
To calculate cooling degree days, average the high and low temperatures for the day. Then, subtract 65 from that total.
[High temperature + low temperature] / 2 - 65 = Cooling degree days
Lowering your energy pain
You have three buckets of options to reduce your energy cost: use less, make it cheaper, or make your own.
Use less
Here are some options for using less energy at home without inconvenience or discomfort.
Adjust your thermostat: Setting your thermostat back 7-10 degrees when you’re gone for eight hours or more can reduce by 10% your home’s biggest energy expense: heating and cooling.
Make your thermostat do it: A smart thermostat can make the set back (and any associated savings) automatic.
Weatherize your home: Beefing up your home’s insulation when needed and stopping cool air from leaking out your doors and windows can cut how often and hard your HVAC needs to run.
Upgrade your HVAC: A new heat pump is likely to be more efficient than an older air conditioner and, when it replaces electric resistance, propane, or heating oil heaters, can deliver significant savings in the winter, too.
Make it cheaper
You can’t force your utility to lower your energy rates, but you can source it more cheaply.
Community solar: Where it’s available and designed to do so, community solar can reduce your energy costs. In effect, you agree to buy some of your electricity from a solar farm at a rate lower than your utility’s rate.
Supply your own
You can’t make your own natural gas or gasoline, but you can generate your own electricity.
Solar panels: Home solar panels can supply some or all of your electricity needs, reducing what you buy from the grid.
Solar battery: Batteries may reduce electric bills by charging when electricity is cheaper (or being generated by solar panels) to avoid more expensive electricity later in the day.
Using PEPI
PEPI captures the growing pain of affording energy in America by tracking three main sources of energy pain: gasoline, natural gas, and electricity. It accounts for price changes, but also the effect that more erratic (and often hotter) weather is affecting energy use, since heating and cooling accounts for close to 50% of the average home’s energy use.
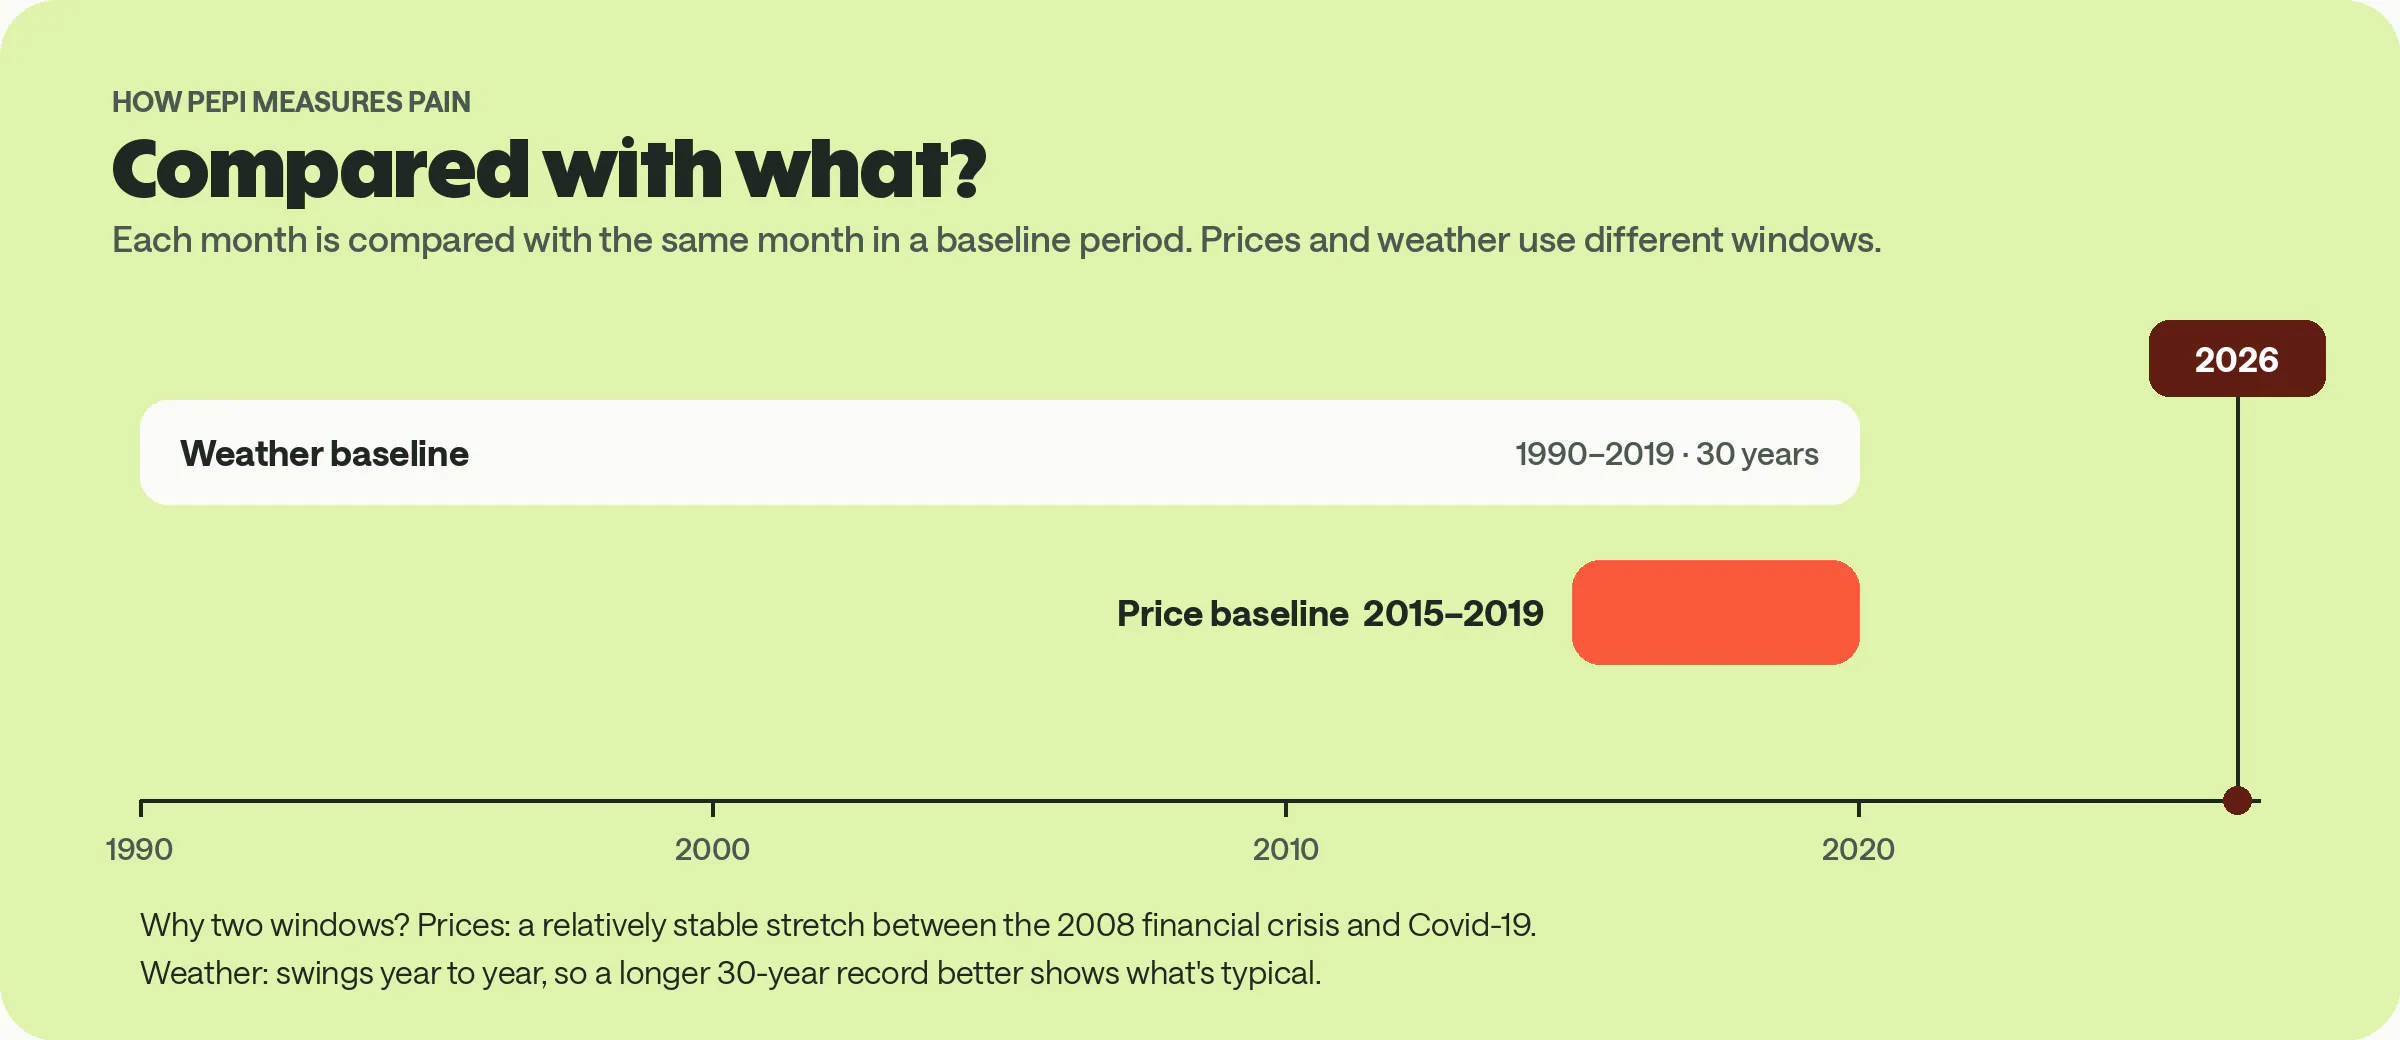
PEPI compares energy pain to a baseline period. For prices, we use 2015-2019: those five years sit between the most direct effects of the 2008 financial crisis and the Covid-19 pandemic. It’s as good a baseline as any for being relatively stable on the energy front and recent enough to be meaningful. For weather, we use 1990-2019, a 30-year window that ends in the same year, because a longer record gives a better sense of what’s typical.
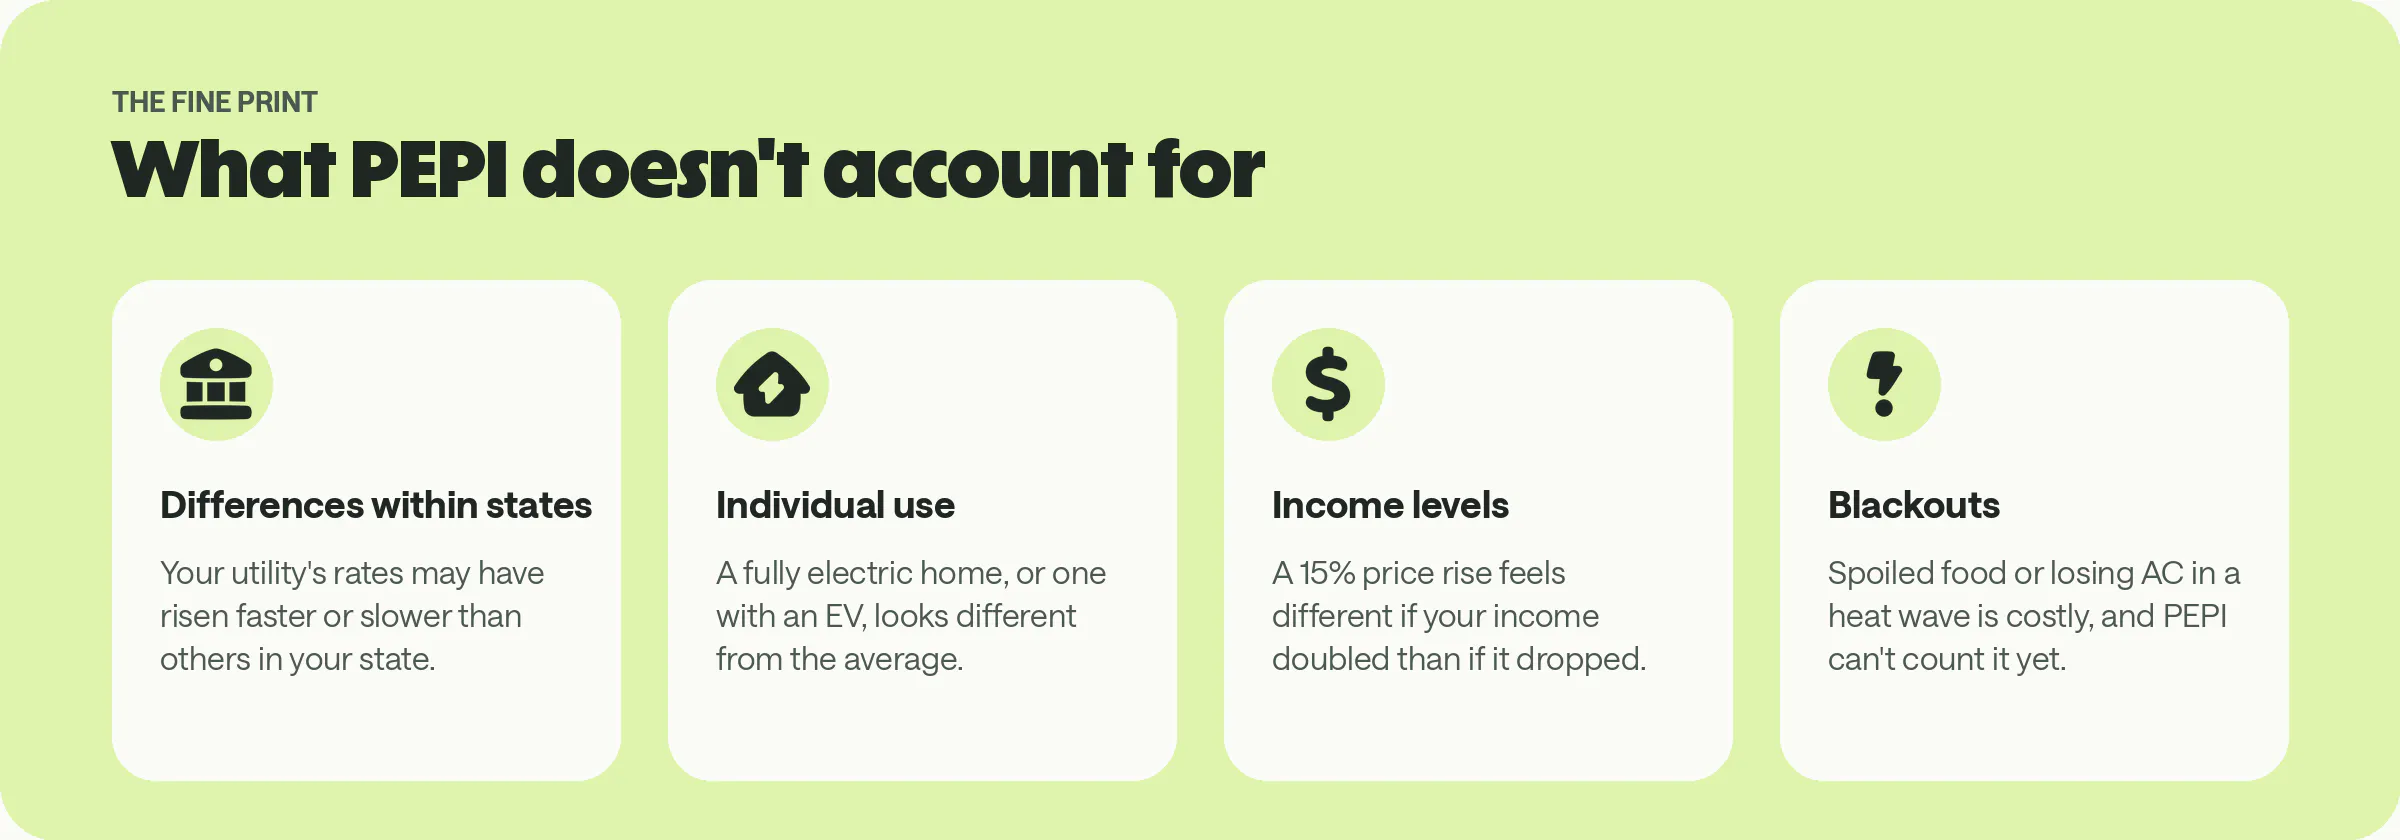
PEPI is still a broad brush. It doesn’t yet capture the pain from blackouts. The gasoline portion doesn’t account for the way driving habits vary between states. By treating states as blocs, PEPI misses some of the nuance of difference between utilities.
Still, PEPI provides a more complete look than tracking just one of the included elements and provides a cleaner look at how energy has gotten more painful over time.
PEPI methodology
PEPI compares the pain of affording energy today to the pain of affording it during a baseline period. It tries to capture the full experience; not just the price, but the amount of energy you need to buy.
It takes into account electricity, natural gas, and gasoline prices, along with state-wide home heating and cooling characteristics and temperature data to combine both price and consumption into one number. Read the complete methodology here.
See how much you can save with home energy changes
Disclaimer: This content is for educational purposes only. Palmetto does not provide tax, legal, or accounting advice. Please consult your own tax, legal, and accounting advisors.